Model Evaluation
Layouts guide for our application.
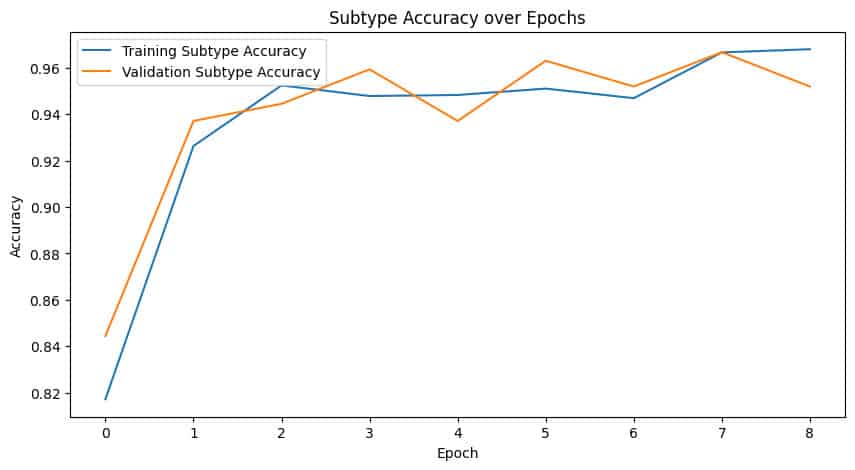
Step 9.1: Plot Training Curves
- Metrics Visualization: Plot the loss, binary accuracy, and subtype accuracy for both training and validation sets across all epochs.
-
Purpose: Helps understand how the model is learning and whether it is overfitting or underfitting.


-
Step 9.2: Evaluate on Test Set
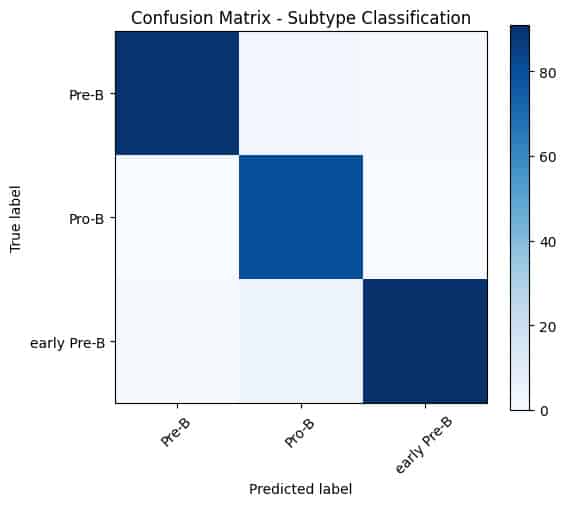
- Evaluation Function: The evaluate_model() function is used to evaluate the model's performance on the test dataset.
-
Metrics: Generates a classification report and confusion matrix for both binary and subtype classification.
-
Purpose: Provides a detailed breakdown of model performance, including precision, recall, and F1-score for each class.


-
Step 9.3: Display Predictions
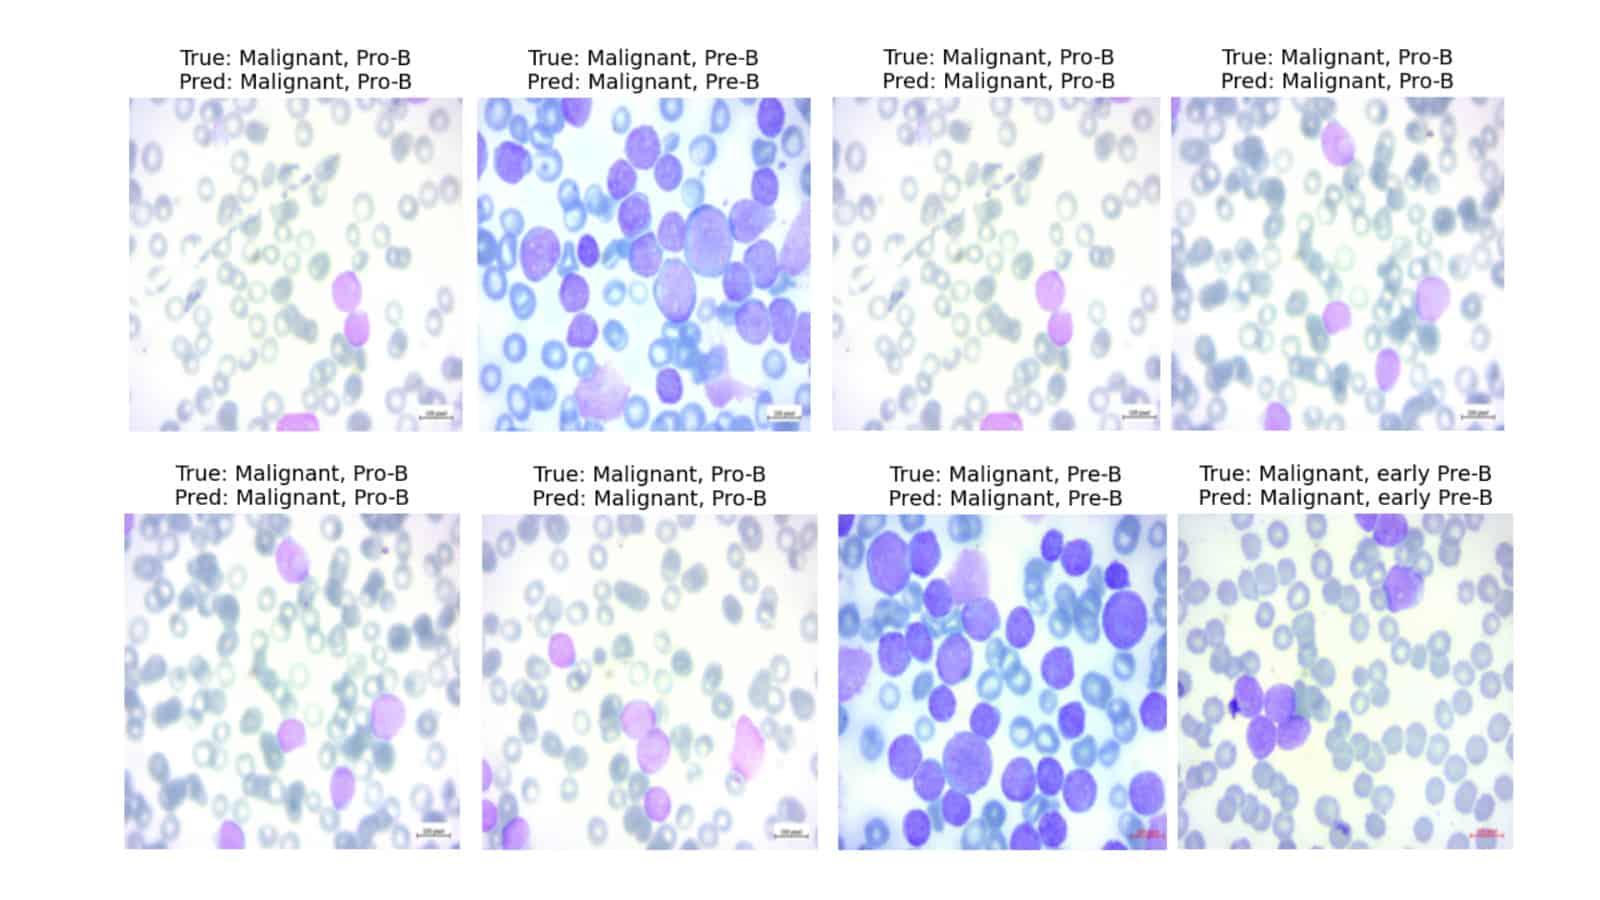
- Display Predictions: The show_predictions() function is used to display model predictions for a few test samples.
-
Visualization: Shows the true and predicted labels for each sample.
-
Purpose: Visually verify the model's predictions and understand its performance on individual images.

-