Exploratory Data Analysis (EDA)
.
Step 5.1: Visualize Class Distribution
-
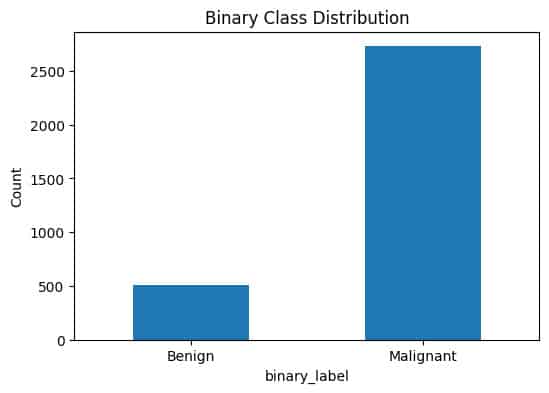
Class Distribution: Visualize the number of images in each class.
- Purpose: Identify any class imbalance, which could negatively impact model performance.
- Visualization: Includes bar charts showing the distribution of Benign vs. Malignant and subtype classes.


Step 5.2: Display Sample Images
-
Sample Images: Display a few sample images from the dataset.
- Purpose: Understand the nature of images (e.g., variations in color, size, quality).
- Verification: Helps verify the correctness of labels and identify potential challenges (e.g., poor image quality).
- Visualization: Displays a set of images with their respective labels.
