Model Evaluation
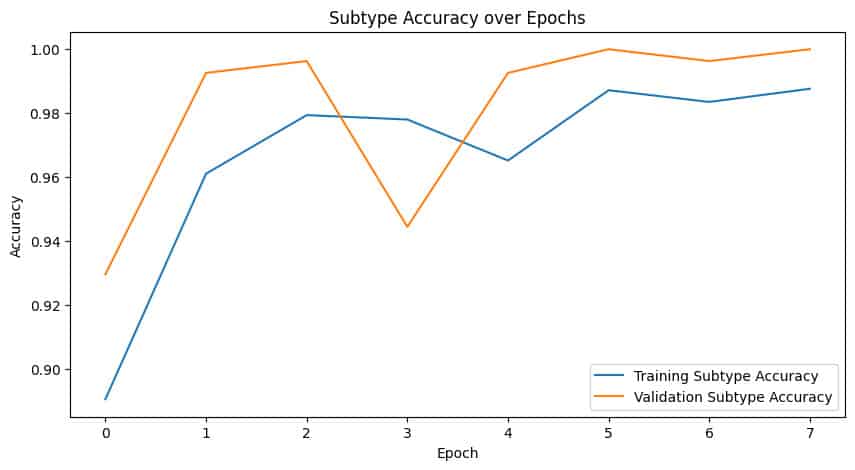
Step 9.1: Plot Training Curves
-
Metrics Visualization: Plot the training and validation loss, binary accuracy, and subtype accuracy over epochs.
- Purpose: Helps visualize the model's learning progress and identify overfitting or underfitting.


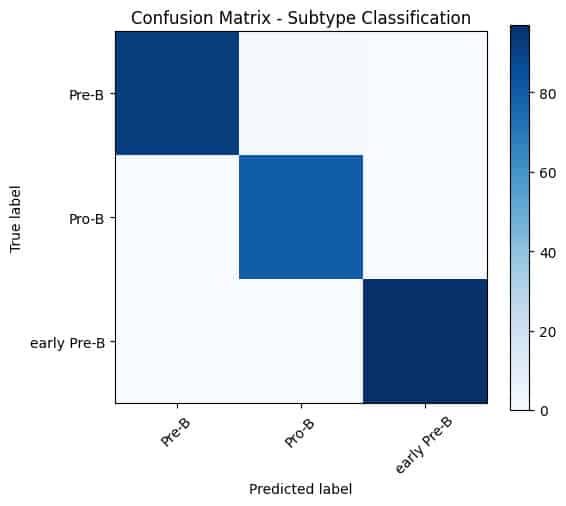
Step 9.2: Evaluate on Test Set
-
Evaluation Function: evaluate_model() to assess the performance on the test dataset.
- Metrics: Classification report and confusion matrix for both binary and subtype classification.
- Purpose: Provides detailed insights into model performance across different classes.


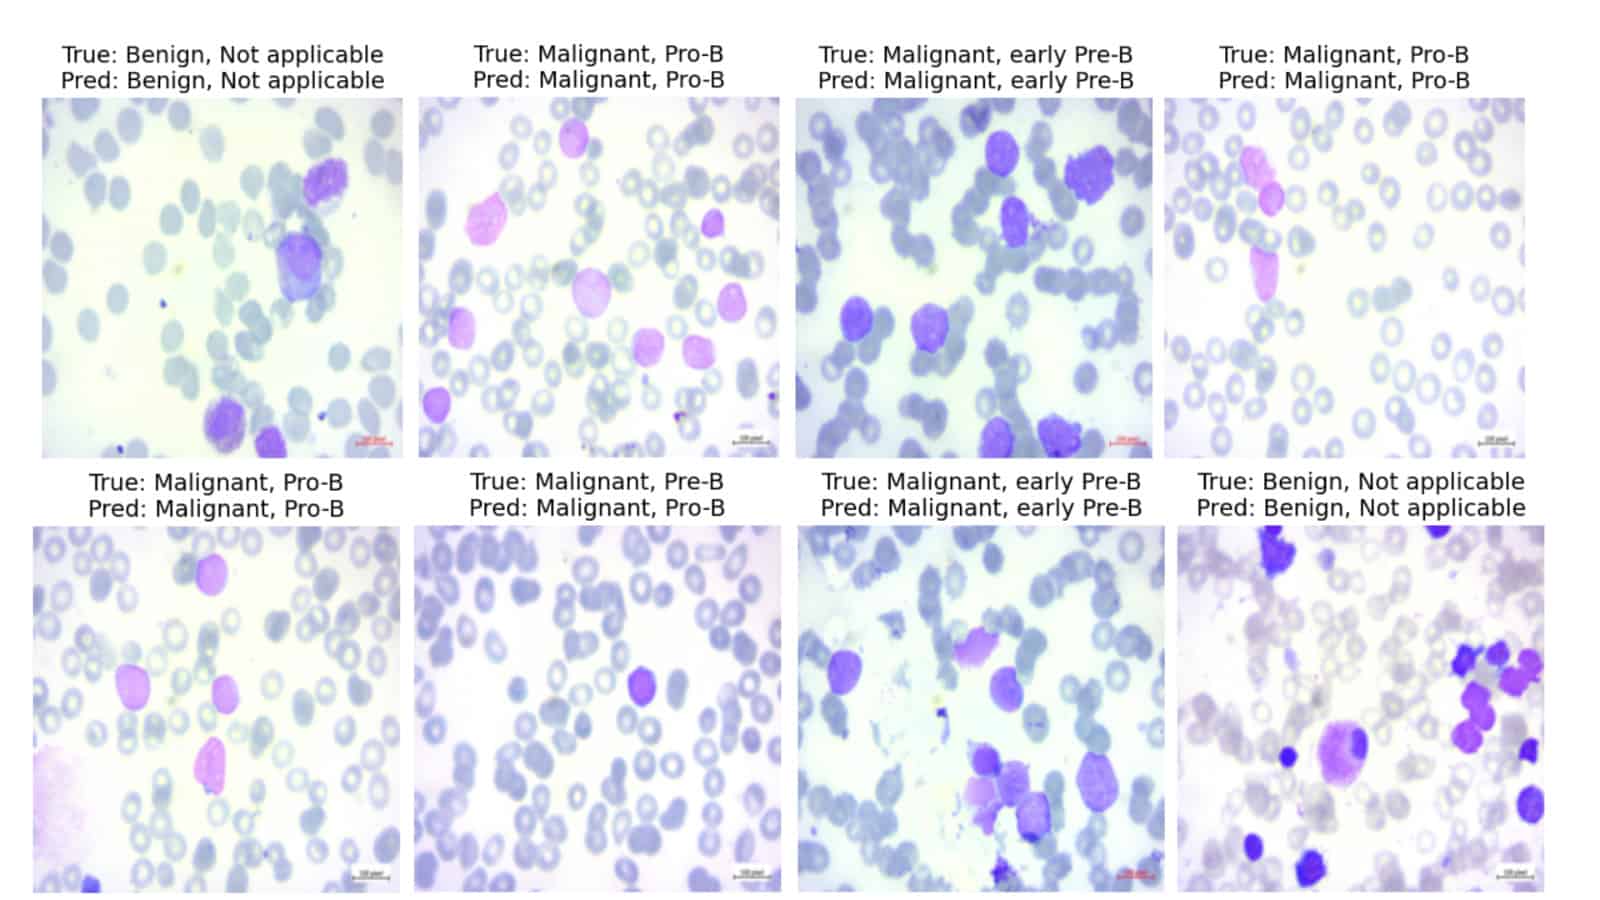
Step 9.3: Display Predictions
- Display Predictions: Visualize predictions along with actual labels on the test set.
-
Function: show_predictions() to display a few samples with predictions.
-
Purpose: Verify how well the model performs on unseen data.

-